Academic Research and
Sample Work
Descriptions of Academic projects research and projects taken on while in Graduate School. A full list can be found in my GitHub Repositories.
Projects Completed
Projects tagged with ⭐ are my personal favorites, do check them out!
Prescriptive Analytics/Modeling | Decision Analytics / Management Science
(Machine Learning: Deterministic and Probabilistic Modeling, Optimization, Simulation)
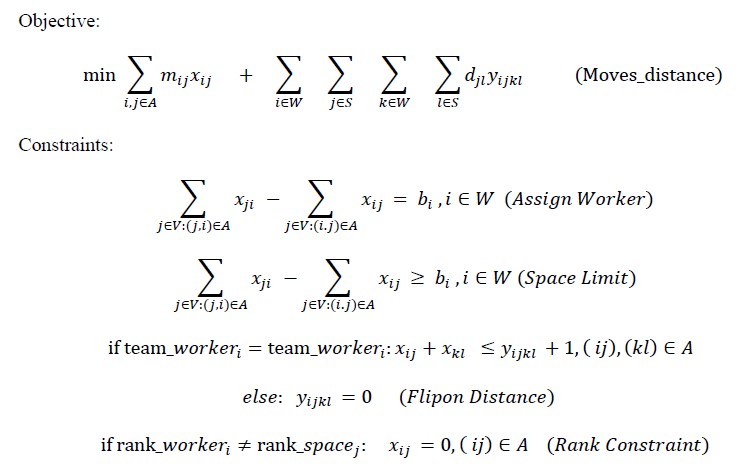
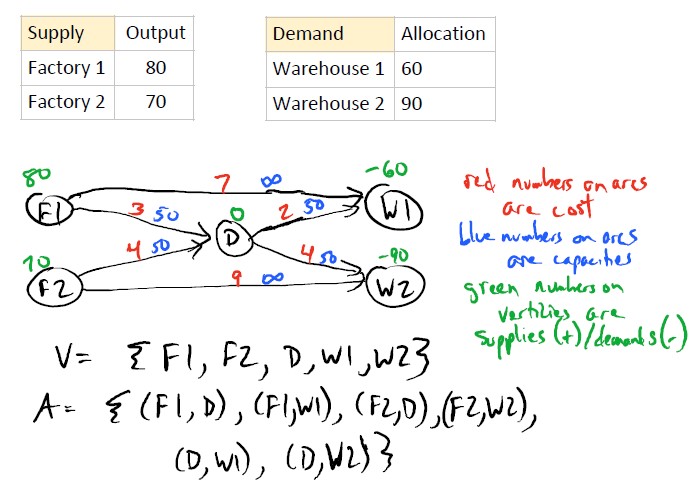
⭐ Federal Reserve Bank of Richmond Workspace Allocation Optimization Won Optimization model class competition issued by Dr. Brooks (M.D.A. department chair and professor). Proposed Python, Pyomo and GLPK network optimization model approach with binary variables and logical constraints to simulate reorganization of 1700 workspaces across 17 floors, while allocating for changing project teams and requirements. Provided report to IT Vice President, Christine Holzem at the Federal Reserve Bank of Richmond.
Optimization and Simulation Proposal for SCC Bureau of Insurance Proposed optimization and simulation framework to benefit helpdesk request distribution and simulate future request volume.
Business Data Analytics
(Modeling via Prediction, Classification and Clustering: Machine Learning, Classification Trees, Regression, Random Forests, Support Vector Machines, etc.)
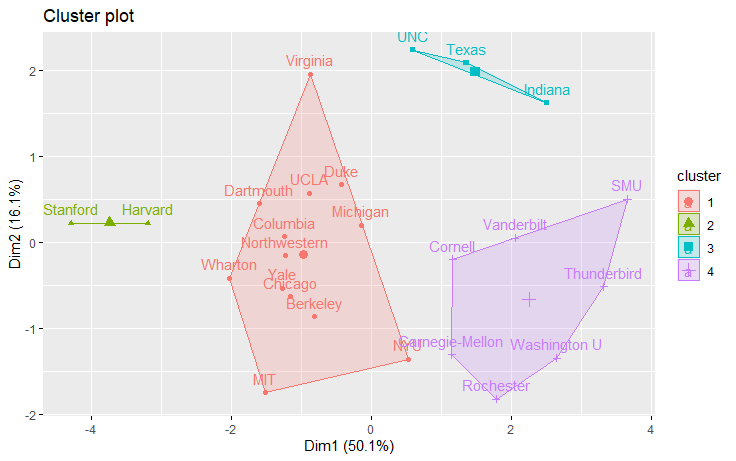
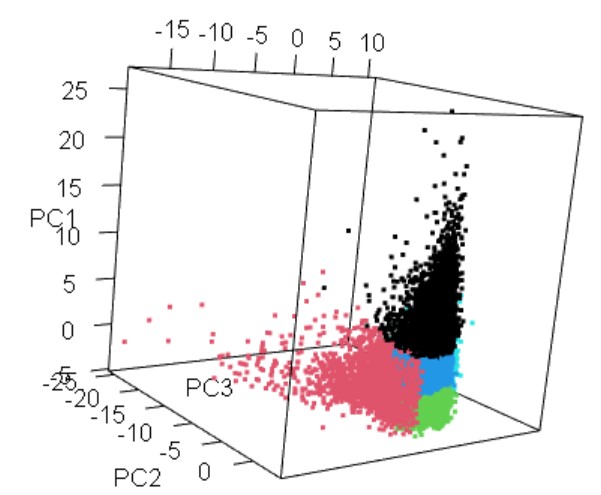
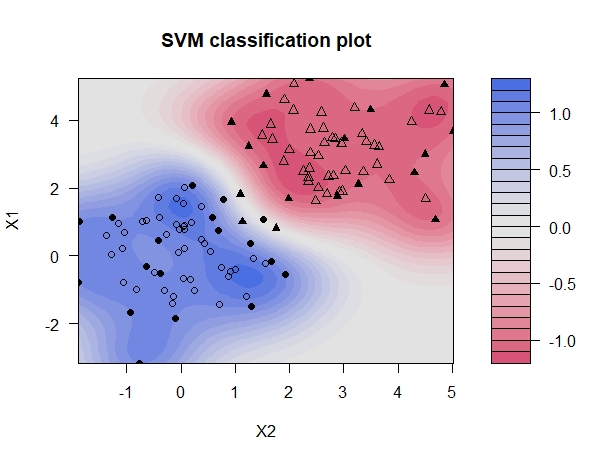
- ⭐ Alchemy Broker Analysis Project: Performed segmentation analysis and predictive modeling on insurance broker performance to conclude a random forest model (highest AUC of 73%) predicted whether 2020 Gross Written Premium will increase or decrease from 2019 with a misclassification rate of 35%. Four classification models (classification trees, logistic regression, random forests, and support vector machines) were built, evaluated, and then tuned for prescriptive measures to analyze broker performance. Explored, visualized, and described five groups of brokers using principal component analysis.
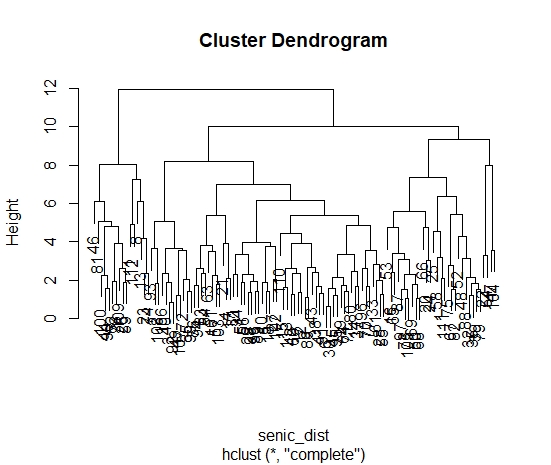
- ⭐ Lending Club Cluster and PCA Repository - Using loan data, performed a k-means cluster analysis to identify 7 groups or clusters and two PCAs of borrowers with multiple variables. Explained all preprocessing steps. Performed PCA to identify characteristics of each cluster. Evaluated how clusters compare to assigning applicants to clusters by loan grade. Supported comparison with visuals.
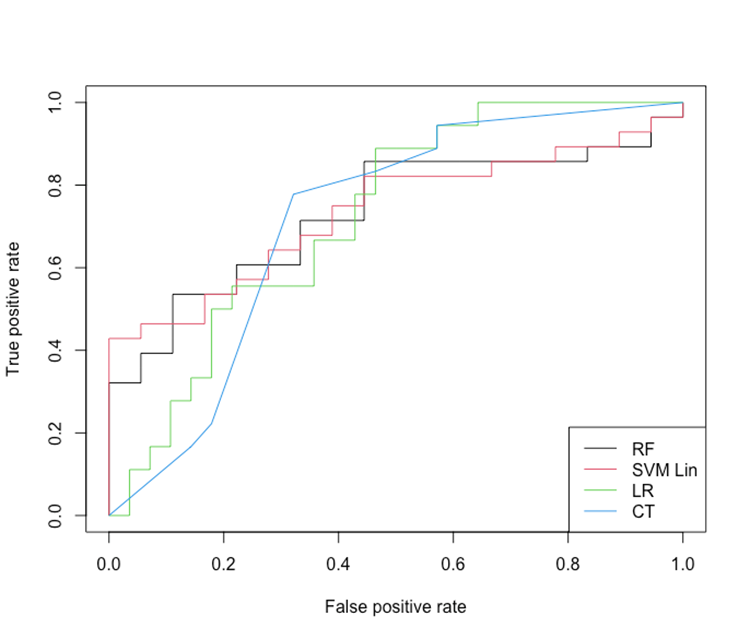
- ⭐ Lending Club Classification Analysis Repository - Built a logistic regression and classification tree models for predicting the final status of a loan based on multiple variables available. Confusion matrix and misclassification rate for each model for a test dataset. Advised variables that appear to be important for predicting outcome. Plotted and described the ROC curves and AUC for the four models to provide my recommendation.
Statistical Analysis and Modeling
Whiskey Analysis Logistic regression model to predict the best and worst whiskeys using Confusion Matrix with training and validation samples. Correlation matrix, goodness of fit statistics, Hosmer-Lemeshow test, chi-squared, confusion matrix, Scatter plots, box plots etc.
Forecasting Methods
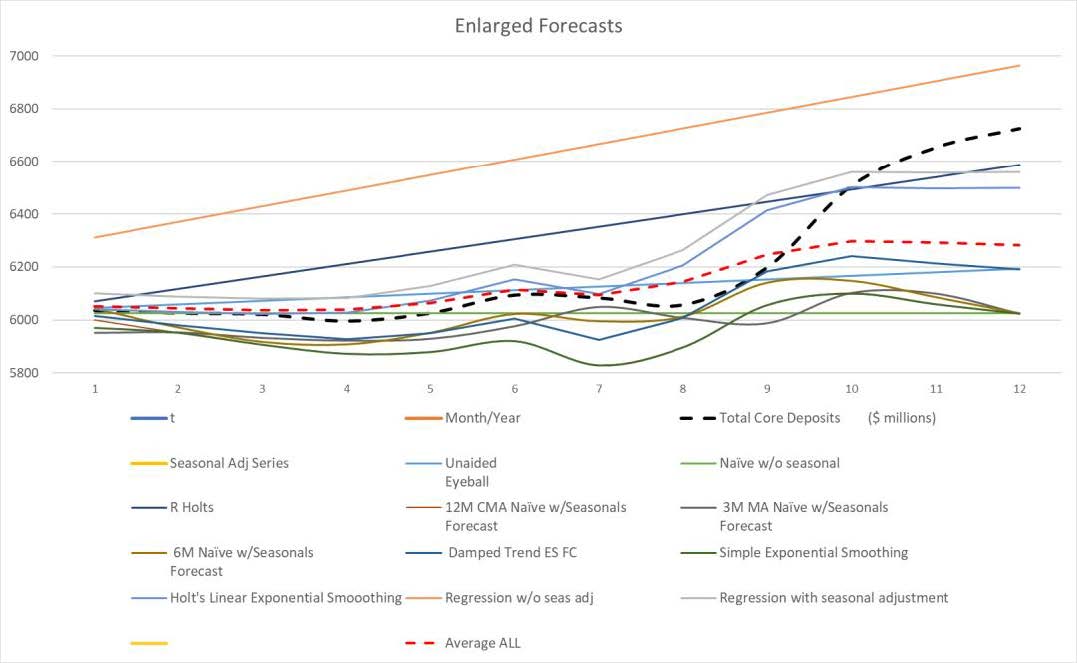
- ⭐ Richmond Bank Total Core Deposit Forecasts Using MS Excel and R, accurately forecasted total core deposit data from a Richmond Bank. The Holt’s Linear Exponential Smoothing had the overall lowest “Quick and Dirty” MAPE (1.2%), the lowest overall Maximum MAPE (3.49%), and consistently more accurate projections for each of the forecast horizons. Overall, the Unaided, Holts Linear Exponential Smoothing, and both regressions overestimated while the Naïve, 12 Month (M) Center Moving Average (CMA), 3M Moving Average (MA), 6M MA, Damped Trend Exponential Smoothing, and Simple Exponential Smoothing underestimated.
Richmond Casino Proposal Analysis Research analysis completed on the proposal of a Richmond, VA Casino presentation including history/background, economic/revenue impact, frustrations, process etc.
New Product Forecasting New product forecasting concepts (such as Delphi method, Assumptions Based, ATAR model, and Sensitivity Analysis) used to forecast and present an innovative smart sticky note printer.
Forecasting with R Forecasting described from the perspective of using R and R studio software.
KJ Manufacturing Company Case Scenario
- Discussed the forecasting process at KJ Manufacturing, any relevant factors about the company and industry that are pertinent to the new forecast and Ken’s forecast.
- Forecasted monthly revenues for KJ Manufacturing for the coming year. Used a variety of methods and graphically displayed them. Explained and supported the new forecasting approach as well as the choice of models and the rational for parameters selected.
- Prepared a report to owner explaining/supporting the forecast.
Decision and Risk Analytics (Decision Tree and Influence Diagram)
⭐ Project Proposal Decision Tree Objectives, uncertainties, influence diagram, assumptions, decision tree model, probability and cumulative comparison node chart (supporting documents – proposal, excel analysis and presentation)
Database Management (SQL/ PostgreSQL)
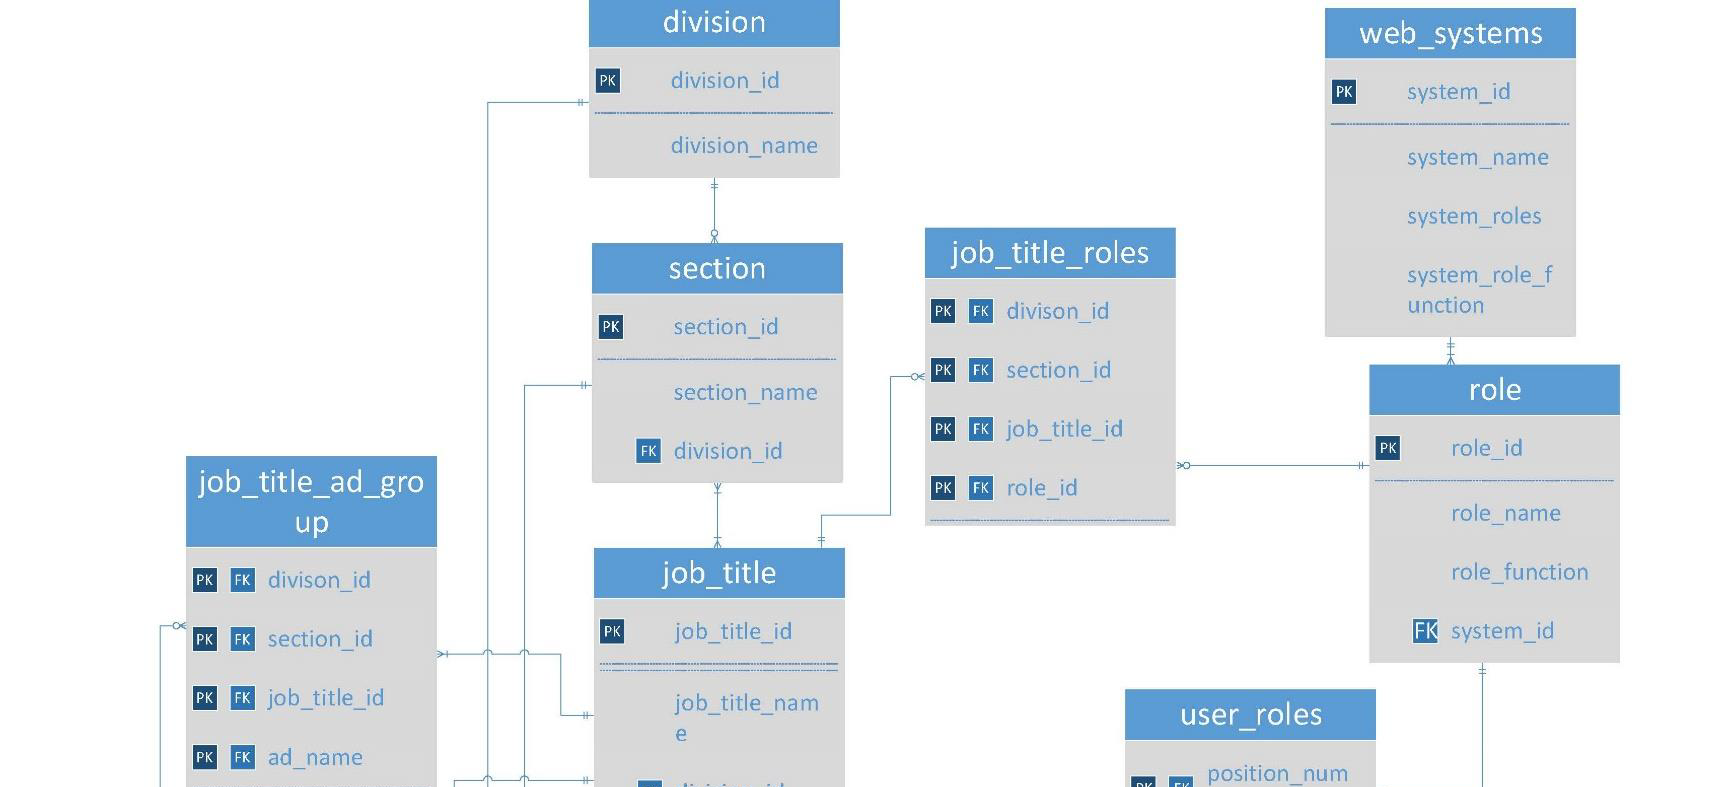 ⭐ Automated Systems DBMS Completed and proposed an Automated Systems Database to Manager - also created a MS Power BI Version. Centralized Relational SQL Database to help produce the appropriate roles for a position, creating consistency throughout departments and job titles (with the exception of optional roles for additional access) and reduce the number of access roles that are kept when changing positions. The DBMS unifies and consolidates system access to improve data security.
Taylor’s Clothing DBMS Business rules, user requirements, ER diagram, entity relationships etc. (Oracle APEX)
Business Policy and Strategy
-
- Industry Analysis
- Environmental Assessment
- Strategic Review
- Growth through Acquisition
Uber’s Failing Brand and Culture Analysis Uber Technologies Inc. brand analysis research report describing brand culture and change strategy. Historical strategic context of the brand, the role culture played in the performance decline of the brand, how the culture impacted financial performance, and how they are attempting to transform and renew the culture.
Lowe’s Case Assessment Lowe’s industry analysis for the market space, brand positioning, environmental assessment, and strategic opportunities/dilemmas.
Quality Management and Six Sigma
 Time Series Apple Watch Workout Analysis Time series health workout data was extracted from my Apple watch to analyze workout variables. A Scope, descriptive statistics, pivot tables, C-Chart and scatter plots were created to check workouts outside of control. Tableau work was used to display correlations.
Data Centric Reengineering
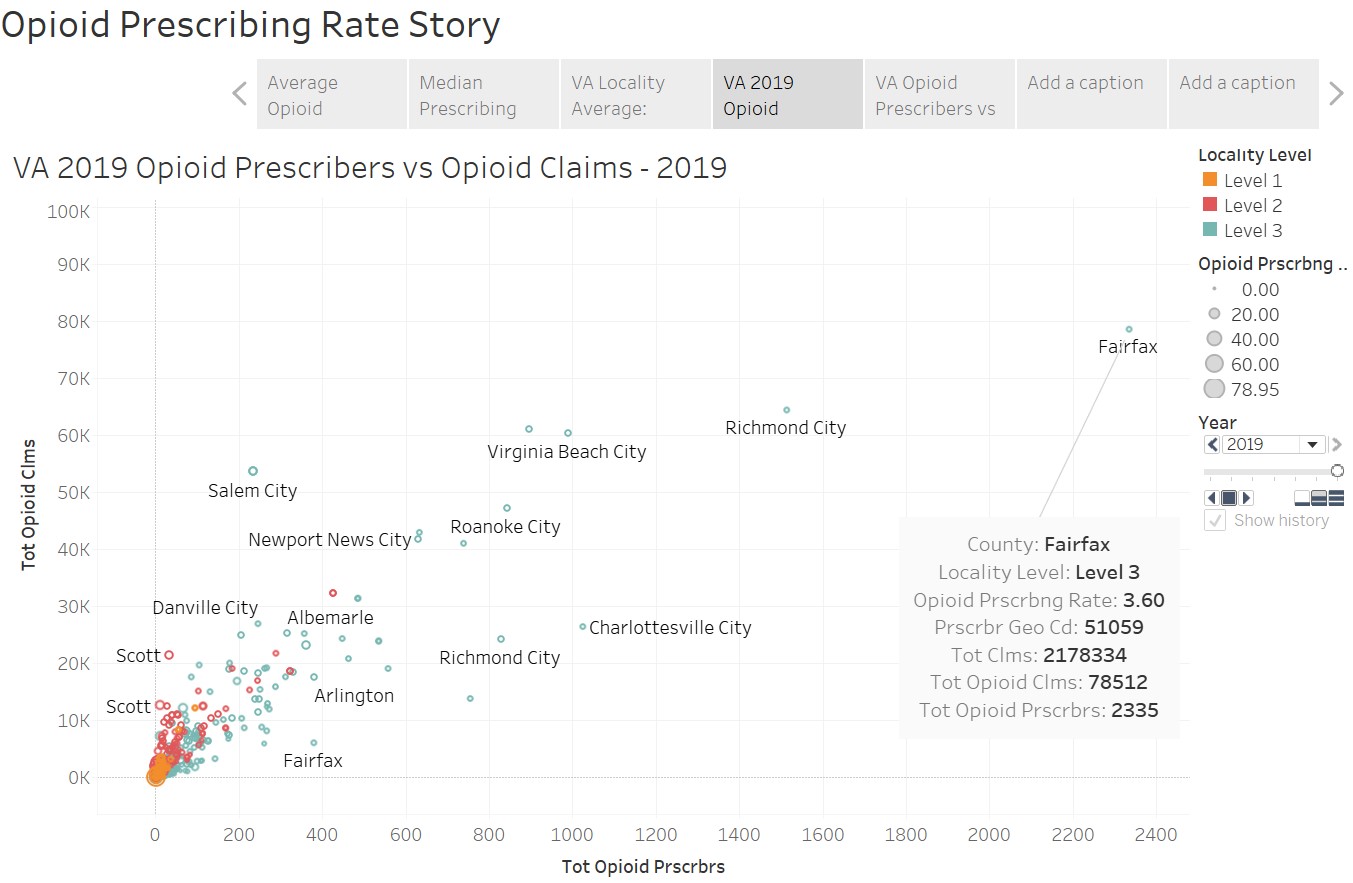
Opioid Prescribing Rates Analysis Semester long project working with Virginia Department of Social Services to assist in data centric reengineer useful data into VA’s major FAACT database. Tableau dashboard analysis and presentation created using data from 2016 to 2019 on Medicare Prescribing rates.
Children’s Bureau Race and Ethnicity Analysis General statistics on the race and ethnicity of children in foster care analyzing statistics on variables such as Child Maltreatment, Children Waiting for Adoption, children adopted etc.